5.1 The Standard Normal Distribution
SLO 3
Describe and apply probability concepts and distributions.
Every normal distribution carries its own units, and the z-score is the way out of them: a value reported as a count of standard deviations from its own mean. That lets you hold an SAT score against an ACT score, and the Empirical Rule says how common any z-score is.
Learning Objectives
By the end of this section, you will be able to:
- explain what the standard normal distribution is and why its mean is zero and its standard deviation is one;
- calculate a z-score from a value, a mean, and a standard deviation, and read its sign and size as a position;
- recover the original value \(x\) from a z-score using \(x = \mu + z\sigma\);
- compare two values that come from differently scaled normal distributions by comparing their z-scores;
- apply the Empirical Rule to say what fraction of the data lies within one, two, and three standard deviations of the mean.
Chapter 4 showed you how to read a probability as an area under a curve. Normal distributions are the curves you will spend the rest of this course reading areas from, and they come in an endless variety: heights in centimeters, test scores out of 800, recovery times in days. Each one has its own center \(\mu\) and its own spread \(\sigma\), so each one is a different curve on a different scale.
That variety is a problem if you want to compare things. Is a height of 168 cm unusual? You cannot answer without knowing the mean and standard deviation of the heights. Is an SAT score of 720 more impressive than an ACT score of 30? The two tests are not even measured in the same units.
This section fixes both problems with one move. We take any normal distribution and re-express every value as how many standard deviations it sits from its own mean. That number is called a z-score, and once you have it the original units are gone. A z-score of \(2\) means the same thing whether it came from centimeters, dollars, or SAT points: two standard deviations above the mean.
5.1.1 Z-Scores
The standard normal distribution is the normal distribution with mean zero and standard deviation one, written \(Z \sim N(0, 1)\). Its values are called standardized values, or z-scores.
Every normal distribution can be converted into this one. If \(X\) is normally distributed with mean \(\mu\) and standard deviation \(\sigma\), the transformation
$$ z = \frac{x - \mu}{\sigma} $$turns \(X \sim N(\mu, \sigma)\) into \(Z \sim N(0, 1)\).
A z-score is a change of units, the way converting to meters lets you compare a Canadian road sign with an American one. Once both values are in standard deviations, the original scales stop mattering and you can put them side by side.
Look at what the formula actually does, one piece at a time, because both pieces have a job. The numerator \(x - \mu\) measures how far the value sits from the center, in the original units. If \(x\) is above the mean that difference is positive; if \(x\) is below the mean it is negative; if \(x\) is exactly the mean it is zero. So the numerator alone already tells you direction. What it cannot tell you is whether that distance is big. A gap of 2 cm is enormous for a machine part and invisible for a person's height. That is what the denominator settles. Dividing by \(\sigma\) asks how the gap compares to the distribution's own typical spread, so the answer comes out as a count of standard deviations rather than a count of centimeters. The two operations together are what make the score portable: subtracting recenters the distribution at zero, dividing rescales it so one unit of spread becomes one unit of measurement.
Definition 5.1.1 - Standardizing changes the ruler under the curve, not the curve.
If \(X\) is a normally distributed random variable and \(X \sim N(\mu, \sigma)\), then the z-score of a value \(x\) is
$$ z = \frac{x - \mu}{\sigma} $$The z-score tells you how many standard deviations \(x\) lies above (to the right of) or below (to the left of) the mean \(\mu\). Values larger than the mean have positive z-scores, values smaller than the mean have negative z-scores, and a value equal to the mean has a z-score of zero.
Rearranging the same equation gives you the trip back. If someone hands you a z-score and you want the original value, multiply and add instead of subtracting and dividing:
$$ x = \mu + z\sigma $$That second form is the one to reach for whenever a problem gives you a standardized score and asks what it was before standardizing. Both forms say the same thing, so which one you use is only ever a question of what you already know.
Definition 5.1.2 - The z-score is the number of standard-deviation steps from the mean to the value.
What is the z-score of \(x\), when \(x = 1\) and \(X \sim N(12, 3)\)?
Solution
Step 1 — Identify the pieces: \(x = 1\), \(\mu = 12\), \(\sigma = 3\).
Step 2 — Substitute into the z-score formula:
$$ z = \frac{x - \mu}{\sigma} = \frac{1 - 12}{3} = \frac{-11}{3} \approx -3.67 $$Answer: \(z \approx -3.67\). The value \(x = 1\) sits about 3.67 standard deviations below the mean of 12, which is far out in the left tail.
Suppose \(X \sim N(5, 6)\). This says \(X\) is a normally distributed random variable with mean \(\mu = 5\) and standard deviation \(\sigma = 6\). Find and interpret the z-score for \(x = 17\), and then for \(x = 1\).
Solution
Step 1 — The z-score for \(x = 17\):
$$ z = \frac{x - \mu}{\sigma} = \frac{17 - 5}{6} = 2 $$So \(x = 17\) is two standard deviations \((2\sigma)\) above, or to the right of, the mean \(\mu = 5\).
Step 2 — Check it with the other form of the formula: \(\mu + z\sigma = 5 + (2)(6) = 17\). The two forms agree, which is the fastest way to catch an arithmetic slip.
Step 3 — The z-score for \(x = 1\):
$$ z = \frac{x - \mu}{\sigma} = \frac{1 - 5}{6} \approx -0.67 $$So \(x = 1\) is 0.67 standard deviations \((-0.67\sigma)\) below, or to the left of, the mean \(\mu = 5\). Checking again: \(5 + (-0.67)(6)\) is approximately one.
Answer: \(z = 2\) for \(x = 17\) and \(z \approx -0.67\) for \(x = 1\). When \(z\) is positive, \(x\) is greater than \(\mu\); when \(z\) is negative, \(x\) is less than \(\mu\).
The sign is doing real work here, so it is worth stating on its own: a positive z-score puts the value to the right of the mean and a negative z-score puts it to the left, always. The size of the number then says how far. Together those two facts let you picture where a value sits on the curve without drawing anything, which is most of what you need for the next few examples.
Fill in the blanks. Camila averages 16 points a game with a standard deviation of four points, so \(X \sim N(16, 4)\). Suppose she scores ten points in a game. The z-score when \(x = 10\) is \(-1.5\). This score tells you that \(x = 10\) is ____ standard deviations to the ____ (right or left) of the mean ____ (what is the mean?).
Solution
Step 1 — Confirm the given z-score:
$$ z = \frac{x - \mu}{\sigma} = \frac{10 - 16}{4} = \frac{-6}{4} = -1.5 $$Step 2 — Read the sign and the size: the value is negative, so \(x = 10\) is to the left of the mean, and its size is 1.5, so it is 1.5 standard deviations away.
Answer: \(x = 10\) is 1.5 standard deviations to the left of the mean 16.
Some doctors believe a person can lose five pounds, on average, in a month by reducing fat intake and exercising consistently. Suppose weight loss has a normal distribution. Let \(X\) = the amount of weight lost (in pounds) by a person in a month, with a standard deviation of two pounds, so \(X \sim N(5, 2)\). Fill in the blanks.
a. Suppose Mai lost ten pounds in a month. The z-score when \(x = 10\) pounds is \(z = 2.5\) (verify). This z-score tells you that \(x = 10\) is ____ standard deviations to the ____ (right or left) of the mean ____ (what is the mean?).
b. Suppose her brother gained three pounds instead (a negative weight loss). Then \(z =\) ____. This z-score tells you that \(x = -3\) is ____ standard deviations to the ____ (right or left) of the mean.
c. Suppose the random variables \(X\) and \(Y\) have the following normal distributions: \(X \sim N(5, 6)\) and \(Y \sim N(2, 1)\). If \(x = 17\), then \(z = 2\) (shown in Example 5.1.1). If \(y = 4\), what is \(z\)?
Solution
Part a — Verify and interpret:
$$ z = \frac{10 - 5}{2} = \frac{5}{2} = 2.5 $$This z-score tells you that \(x = 10\) is 2.5 standard deviations to the right of the mean five.
Part b — A gain is a negative loss: gaining three pounds means \(x = -3\).
$$ z = \frac{-3 - 5}{2} = \frac{-8}{2} = -4 $$So \(z = -4\). This z-score tells you that \(x = -3\) is four standard deviations to the left of the mean.
Part c — Standardize \(y\) against its own distribution: here \(\mu = 2\) and \(\sigma = 1\).
$$ z = \frac{y - \mu}{\sigma} = \frac{4 - 2}{1} = 2 $$Answer: a. 2.5, right, five. b. \(z = -4\), four, left. c. \(z = 2\).
The z-score for \(y = 4\) is \(z = 2\), meaning four is two standard deviations to the right of its mean. So \(x = 17\) and \(y = 4\) are both two of their own standard deviations to the right of their respective means.
That last part is the whole reason z-scores exist, so it is worth slowing down on. Suppose \(X \sim N(5, 6)\) records weight gains for one group of people trying to gain weight over six weeks, and \(Y \sim N(2, 1)\) records the same weight gain for a second group. The two groups gained different amounts on average and varied by different amounts, so the raw numbers 17 and 4 are not comparable at all — one is more than four times the other. But once you standardize, both come out at \(z = 2\). Relative to their own groups, the two people did equally well. The z-score allows us to compare data that are scaled differently, and that is a capability the raw values simply do not have.
The mean height of 15- to 18-year-old males from Chile from 2009 to 2010 was 170 cm with a standard deviation of 6.28 cm, and male heights follow a normal distribution, so \(X \sim N(170, 6.28)\).
a. Suppose a 15- to 18-year-old male from Chile was 176 cm tall from 2009 to 2010. The z-score when \(x = 176\) cm is \(z =\) ____. This z-score tells you that \(x = 176\) cm is ____ standard deviations to the ____ (right or left) of the mean ____ (what is the mean?).
b. Suppose the height of a 15- to 18-year-old male from Chile from 2009 to 2010 has a z-score of \(z = -2\). What is the male's height? The z-score tells you that the male's height is ____ standard deviations to the ____ (right or left) of the mean.
Solution
Part a — Standardize:
$$ z = \frac{176 - 170}{6.28} = \frac{6}{6.28} \approx 0.96 $$So \(x = 176\) cm is about 0.96 standard deviations to the right of the mean 170 cm.
Part b — Go the other way with \(x = \mu + z\sigma\):
$$ x = 170 + (-2)(6.28) = 170 - 12.56 = 157.44 $$Answer: a. \(z \approx 0.96\), 0.96, right, 170 cm. b. 157.44 cm, two standard deviations to the left of the mean.
The mean height of 15- to 18-year-old males from Chile from 2009 to 2010 was 170 cm with a standard deviation of 6.28 cm. Male heights are known to follow a normal distribution. Let \(X\) = the height of a 15- to 18-year-old male from Chile in 2009 to 2010. Then \(X \sim N(170, 6.28)\).
a. Suppose a 15- to 18-year-old male from Chile was 168 cm tall from 2009 to 2010. The z-score when \(x = 168\) cm is \(z =\) ____. This z-score tells you that \(x = 168\) is ____ standard deviations to the ____ (right or left) of the mean ____ (what is the mean?).
b. Suppose that the height of a 15- to 18-year-old male from Chile from 2009 to 2010 has a z-score of \(z = 1.27\). What is the male's height? The z-score tells you that the male's height is ____ standard deviations to the ____ (right or left) of the mean.
Solution
Part a — Standardize:
$$ z = \frac{168 - 170}{6.28} = \frac{-2}{6.28} \approx -0.32 $$The value is negative, so 168 cm sits below the mean: \(x = 168\) is 0.32 standard deviations to the left of the mean 170.
Part b — Use \(x = \mu + z\sigma\):
$$ x = 170 + (1.27)(6.28) = 170 + 7.9756 \approx 177.98 $$The male's height is 177.98 cm, which is 1.27 standard deviations to the right of the mean.
Answer: a. \(-0.32\), 0.32, left, 170. b. 177.98 cm, 1.27, right.
In 2012, 1,664,479 students took the SAT exam. The distribution of scores in the verbal section had a mean \(\mu = 496\) and a standard deviation \(\sigma = 114\). Let \(X\) = an SAT verbal section score in 2012, so \(X \sim N(496, 114)\). Devan is working through a score report with their partner Arjun, and they want to know how two particular verbal scores compare.
Find the z-scores for \(x_1 = 325\) and \(x_2 = 366.21\). Interpret each z-score. What can you say about \(x_1 = 325\) and \(x_2 = 366.21\) as they compare to their mean and standard deviation?
Solution
Step 1 — Standardize the first score:
$$ z_1 = \frac{325 - 496}{114} = \frac{-171}{114} = -1.5 $$Step 2 — Standardize the second score:
$$ z_2 = \frac{366.21 - 496}{114} = \frac{-129.79}{114} \approx -1.14 $$Step 3 — Interpret: a score of 325 is 1.5 standard deviations below the mean of 496. A score of 366.21 is about 1.14 standard deviations below the mean.
Answer: \(z_1 = -1.5\) and \(z_2 \approx -1.14\). Both scores are below the mean, and 325 is the further of the two — it sits deeper in the left tail than 366.21 does.
From 1984 to 1985, the mean height of 15- to 18-year-old males from Chile was 172.36 cm and the standard deviation was 6.34 cm. Let \(Y\) = the height of 15- to 18-year-old males from 1984 to 1985, so \(Y \sim N(172.36, 6.34)\).
From 2009 to 2010, the mean height of 15- to 18-year-old males from Chile was 170 cm with a standard deviation of 6.28 cm. Let \(X\) = the height of a 15- to 18-year-old male from Chile in 2009 to 2010, so \(X \sim N(170, 6.28)\).
Find the z-scores for \(x = 160.58\) cm and \(y = 162.85\) cm. Interpret each z-score. What can you say about \(x = 160.58\) cm and \(y = 162.85\) cm as they compare to their respective means and standard deviations?
Solution
Step 1 — Standardize \(x\) against the 2009-2010 distribution:
$$ z = \frac{160.58 - 170}{6.28} = \frac{-9.42}{6.28} = -1.5 $$Step 2 — Standardize \(y\) against the 1984-1985 distribution:
$$ z = \frac{162.85 - 172.36}{6.34} = \frac{-9.51}{6.34} = -1.5 $$Step 3 — Compare: the raw heights differ by more than 2 cm, and the two distributions have different centers and different spreads. But both standardized scores come out to \(-1.5\).
Answer: the z-score for \(x = 160.58\) is \(z = -1.5\) and the z-score for \(y = 162.85\) is \(z = -1.5\). Both values deviate the same number of standard deviations from their respective means, and in the same direction. Relative to the population each was drawn from, the two males were equally short.
Try it in rāSHio
The example above claims the two heights sit at the same place in their own distributions, and rāSHio will show you that instead of asking you to take it on faith. Choose Distributions → Normal, pick Left, and enter mean 170, standard deviation 6.28, value 160.58; then run it again with 172.36, 6.34, and 162.85 — the same area comes back both times, which is what a shared z-score of \(-1.5\) actually means.
Figure 5.1.1 — Reading a left-tail area in rāSHio: Distributions → Normal, demonstrated on X ~ N(100, 15) with a cutoff at 115 — the panel's twin axes label that point in x-units and in z at once.
5.1.2 The Empirical Rule
If \(X\) is a random variable with a normal distribution with mean \(\mu\) and standard deviation \(\sigma\), then the Empirical Rule states:
- about 68% of the \(x\) values lie between \(-1\sigma\) and \(+1\sigma\) of the mean \(\mu\) (within one standard deviation of the mean);
- about 95% of the \(x\) values lie between \(-2\sigma\) and \(+2\sigma\) of the mean \(\mu\) (within two standard deviations of the mean);
- about 99.7% of the \(x\) values lie between \(-3\sigma\) and \(+3\sigma\) of the mean \(\mu\) (within three standard deviations of the mean).
The 95% band in the rule is why researchers so often treat two standard deviations as the line between ordinary and surprising. Anything past \(2\sigma\) happens to about one observation in twenty, which is rare enough to be worth a second look.
Notice that almost all the \(x\) values lie within three standard deviations of the mean. The z-scores for \(+1\sigma\) and \(-1\sigma\) are \(+1\) and \(-1\); the z-scores for \(+2\sigma\) and \(-2\sigma\) are \(+2\) and \(-2\); the z-scores for \(+3\sigma\) and \(-3\sigma\) are \(+3\) and \(-3\). The Empirical Rule is also known as the 68-95-99.7 rule.
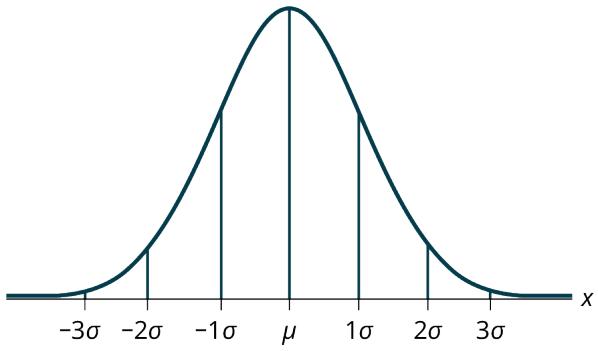
Figure 5.1.2 — The normal curve divided at \(\mu\) and at each standard deviation out to \(3\sigma\), the bands the Empirical Rule describes.
Read the rule off Figure 5.1.2 and one detail jumps out: the percentages are not evenly spaced. Going from one standard deviation to two only buys you another 27 percentage points, and going from two to three buys about 4.7 more. The curve is tallest in the middle, so most of the area is already accounted for before you get far from the mean, and the tails contribute very little no matter how far out you go. That is what makes a z-score past 3 genuinely remarkable rather than merely large. It also tells you which direction the rule is useful in. Given a value, you can say roughly how common it is; given a percentage, you can work backward to the stretch of values that holds it. The two exercises that follow run the rule in each of those directions, so check which one a question is asking for before you start computing. Keep in mind too that these are approximations, good to a couple of tenths of a percent. The exact areas are 68.27%, 95.45%, and 99.73%, which is why a problem that quotes those longer figures is still asking about the same three bands.
Suppose \(X\) has a normal distribution with mean 25 and standard deviation five. Between what values of \(x\) do 68% of the values lie?
Solution
Step 1 — The 68% band is one standard deviation on each side of the mean.
Step 2 — Go one standard deviation down and one up:
$$ 25 - (1)(5) = 20 \qquad \text{and} \qquad 25 + (1)(5) = 30 $$Answer: about 68% of the values lie between \(x = 20\) and \(x = 30\).
Suppose \(x\) has a normal distribution with mean 50 and standard deviation six. Describe the 68%, 95%, and 99.7% bands and give the z-scores at each edge.
Solution
Step 1 — The 68% band: about 68% of the \(x\) values lie within one standard deviation of the mean, so between \(-1\sigma = (-1)(6) = -6\) and \(1\sigma = (1)(6) = 6\) of the mean 50. The values \(50 - 6 = 44\) and \(50 + 6 = 56\) are within one standard deviation of the mean. The z-scores are \(-1\) and \(+1\) for 44 and 56.
Step 2 — The 95% band: about 95% of the \(x\) values lie within two standard deviations of the mean, so between \(-2\sigma = (-2)(6) = -12\) and \(2\sigma = (2)(6) = 12\). The values \(50 - 12 = 38\) and \(50 + 12 = 62\) are within two standard deviations of the mean. The z-scores are \(-2\) and \(+2\) for 38 and 62.
Step 3 — The 99.7% band: about 99.7% of the \(x\) values lie within three standard deviations of the mean, so between \(-3\sigma = (-3)(6) = -18\) and \(3\sigma = (3)(6) = 18\). The values \(50 - 18 = 32\) and \(50 + 18 = 68\) are within three standard deviations of the mean. The z-scores are \(-3\) and \(+3\) for 32 and 68.
Answer: 68% between 44 and 56, 95% between 38 and 62, and 99.7% between 32 and 68.
Try it in rāSHio
The three bands the example just walked through are rounded areas, and rāSHio will hand you the exact ones. Choose Distributions → Normal, pick Between, set mean 50 and standard deviation 6, then read the area for the bounds 44 and 56, then 38 and 62, then 32 and 68 — 0.6827, 0.9545, and 0.9973, the numbers the 68-95-99.7 rule rounds off.
The scores on a college entrance exam have an approximate normal distribution with mean \(\mu = 52\) points and standard deviation \(\sigma = 11\) points.
a. About 68% of the values lie between what two values? The z-scores are ____, respectively.
b. About 95% of the values lie between what two values? The z-scores are ____, respectively.
c. About 99.7% of the values lie between what two values? The z-scores are ____, respectively.
Solution
Part a — One standard deviation out: \(52 - 11 = 41\) and \(52 + 11 = 63\). About 68% of the values lie between 41 and 63. The z-scores are \(-1\) and \(1\).
Part b — Two standard deviations out: \(52 - 22 = 30\) and \(52 + 22 = 74\). About 95% of the values lie between 30 and 74. The z-scores are \(-2\) and \(2\).
Part c — Three standard deviations out: \(52 - 33 = 19\) and \(52 + 33 = 85\). About 99.7% of the values lie between 19 and 85. The z-scores are \(-3\) and \(3\).
Answer: a. 41 and 63; \(-1\) and \(1\). b. 30 and 74; \(-2\) and \(2\). c. 19 and 85; \(-3\) and \(3\).
From 1984 to 1985, the mean height of 15- to 18-year-old males from Chile was 172.36 cm and the standard deviation was 6.34 cm. Let \(Y\) = the height of 15- to 18-year-old males in 1984 to 1985, so \(Y \sim N(172.36, 6.34)\).
a. About 68% of the \(y\) values lie between what two values? These values are ____. The z-scores are ____, respectively.
b. About 95% of the \(y\) values lie between what two values? These values are ____. The z-scores are ____, respectively.
c. About 99.7% of the \(y\) values lie between what two values? These values are ____. The z-scores are ____, respectively.
Solution
Part a — One standard deviation on each side:
$$ 172.36 - 6.34 = 166.02 \qquad \text{and} \qquad 172.36 + 6.34 = 178.70 $$About 68% of the values lie between 166.02 cm and 178.7 cm. The z-scores are \(-1\) and \(1\).
Part b — Two standard deviations on each side:
$$ 172.36 - (2)(6.34) = 159.68 \qquad \text{and} \qquad 172.36 + (2)(6.34) = 185.04 $$About 95% of the values lie between 159.68 cm and 185.04 cm. The z-scores are \(-2\) and \(2\).
Part c — Three standard deviations on each side:
$$ 172.36 - (3)(6.34) = 153.34 \qquad \text{and} \qquad 172.36 + (3)(6.34) = 191.38 $$About 99.7% of the values lie between 153.34 cm and 191.38 cm. The z-scores are \(-3\) and \(3\).
Answer: a. 166.02 cm to 178.7 cm, z-scores \(-1\) and 1. b. 159.68 cm to 185.04 cm, z-scores \(-2\) and 2. c. 153.34 cm to 191.38 cm, z-scores \(-3\) and 3.
Problem Set 5.1
Problem 1. A bottle of water contains 12.05 fluid ounces with a standard deviation of 0.01 ounces. Define the random variable \(X\) in words. \(X =\) ____.
Solution
Step 1 — Ask what is being measured: the numbers 12.05 ounces and 0.01 ounces describe how much water is in a bottle and how much that amount varies from bottle to bottle.
Step 2 — Write the variable in words: a random variable is always "the [measurement] of a randomly chosen [thing]."
Answer: \(X\) = the amount of water, in fluid ounces, in a randomly chosen bottle.
Problem 2. A normal distribution has a mean of 61 and a standard deviation of 15. What is the median?
Solution
Step 1 — Use the symmetry of the normal curve: a normal distribution is symmetric about its center, so half the area falls on each side of the mean.
Step 2 — Apply that to the median: the median is the value with half the area to its left, which is exactly the mean.
Answer: the median is 61.
Problem 3. \(X \sim N(1, 2)\). \(\sigma =\) ____
Solution
Step 1 — Read the notation: \(X \sim N(\mu, \sigma)\) lists the mean first and the standard deviation second.
Step 2 — Match the positions: in \(N(1, 2)\), the mean is 1 and the standard deviation is 2.
Answer: \(\sigma = 2\).
Problem 4. A company manufactures rubber balls. The mean diameter of a ball is 12 cm with a standard deviation of 0.2 cm. Define the random variable \(X\) in words. \(X =\) ____.
Solution
Step 1 — Identify the measurement: 12 cm is an average diameter and 0.2 cm is how much diameters vary from ball to ball.
Step 2 — State the variable: describe one randomly selected ball, not the whole batch.
Answer: \(X\) = the diameter, in centimeters, of a randomly chosen rubber ball.
Problem 5. \(X \sim N(-4, 1)\). What is the median?
Solution
Step 1 — Recall the symmetry rule: for any normal distribution the median equals the mean.
Step 2 — Read the mean off the notation: \(N(-4, 1)\) has \(\mu = -4\).
Answer: the median is \(-4\).
Problem 6. \(X \sim N(3, 5)\). \(\sigma =\) ____
Solution
Step 1 — Read the second entry of the notation: \(N(3, 5)\) gives \(\mu = 3\) and \(\sigma = 5\).
Answer: \(\sigma = 5\).
Problem 7. \(X \sim N(-2, 1)\). \(\mu =\) ____
Solution
Step 1 — Read the first entry of the notation: \(N(-2, 1)\) gives \(\mu = -2\) and \(\sigma = 1\).
Answer: \(\mu = -2\).
Problem 8. What does a z-score measure?
Solution
Step 1 — Look at what the formula does: \(z = (x - \mu)/\sigma\) subtracts the mean to get a distance, then divides by the standard deviation to express that distance in units of spread.
Step 2 — Say what the result means: the answer is a count of standard deviations, and its sign says which side of the mean the value is on.
Answer: a z-score measures how many standard deviations a value lies above (positive) or below (negative) the mean of its distribution.
Problem 9. What does standardizing a normal distribution do to the mean?
Solution
Step 1 — Standardize the mean itself: substitute \(x = \mu\) into the formula.
$$ z = \frac{\mu - \mu}{\sigma} = \frac{0}{\sigma} = 0 $$Answer: the mean becomes zero.
Problem 10. Is \(X \sim N(0, 1)\) a standardized normal distribution? Why or why not?
Solution
Step 1 — Recall the definition: the standard normal distribution is the normal distribution with mean zero and standard deviation one.
Step 2 — Compare: \(N(0, 1)\) has \(\mu = 0\) and \(\sigma = 1\), which is exactly that.
Answer: yes. \(X \sim N(0, 1)\) is the standard normal distribution, because its mean is zero and its standard deviation is one.
Problem 11. What is the z-score of \(x = 12\), if it is two standard deviations to the right of the mean?
Solution
Step 1 — Translate the words into a z-score: "two standard deviations to the right of the mean" is the definition of a z-score of 2 — right means positive.
Answer: \(z = 2\).
Problem 12. What is the z-score of \(x = 9\), if it is 1.5 standard deviations to the left of the mean?
Solution
Step 1 — Translate the words: 1.5 standard deviations away gives a size of 1.5, and "to the left" makes the sign negative.
Answer: \(z = -1.5\).
Problem 13. What is the z-score of \(x = -2\), if it is 2.78 standard deviations to the right of the mean?
Solution
Step 1 — Translate the words: 2.78 standard deviations away, to the right, so the sign is positive.
Step 2 — Note that the value of \(x\) itself does not matter: the z-score only reports position relative to the mean, so a negative \(x\) can still have a positive z-score.
Answer: \(z = 2.78\).
Problem 14. What is the z-score of \(x = 7\), if it is 0.133 standard deviations to the left of the mean?
Solution
Step 1 — Translate the words: 0.133 standard deviations away, to the left, so the sign is negative.
Answer: \(z = -0.133\).
Problem 15. Suppose \(X \sim N(2, 6)\). What value of \(x\) has a z-score of three?
Solution
Step 1 — Use the form that recovers \(x\): \(x = \mu + z\sigma\), with \(\mu = 2\), \(\sigma = 6\), \(z = 3\).
Step 2 — Substitute:
$$ x = 2 + (3)(6) = 2 + 18 = 20 $$Answer: \(x = 20\).
Problem 16. Suppose \(X \sim N(8, 1)\). What value of \(x\) has a z-score of \(-2.25\)?
Solution
Step 1 — Use \(x = \mu + z\sigma\) with \(\mu = 8\), \(\sigma = 1\), \(z = -2.25\).
Step 2 — Substitute:
$$ x = 8 + (-2.25)(1) = 5.75 $$Answer: \(x = 5.75\).
Problem 17. Suppose \(X \sim N(9, 5)\). What value of \(x\) has a z-score of \(-0.5\)?
Solution
Step 1 — Use \(x = \mu + z\sigma\) with \(\mu = 9\), \(\sigma = 5\), \(z = -0.5\).
Step 2 — Substitute:
$$ x = 9 + (-0.5)(5) = 9 - 2.5 = 6.5 $$Answer: \(x = 6.5\).
Problem 18. Suppose \(X \sim N(2, 3)\). What value of \(x\) has a z-score of \(-0.67\)?
Solution
Step 1 — Use \(x = \mu + z\sigma\) with \(\mu = 2\), \(\sigma = 3\), \(z = -0.67\).
Step 2 — Substitute:
$$ x = 2 + (-0.67)(3) = 2 - 2.01 = -0.01 $$Answer: \(x = -0.01\).
Problem 19. Suppose \(X \sim N(4, 2)\). What value of \(x\) is 1.5 standard deviations to the left of the mean?
Solution
Step 1 — Turn the wording into a z-score: 1.5 standard deviations to the left means \(z = -1.5\).
Step 2 — Recover \(x\) with \(\mu = 4\) and \(\sigma = 2\):
$$ x = 4 + (-1.5)(2) = 4 - 3 = 1 $$Answer: \(x = 1\).
Problem 20. Suppose \(X \sim N(4, 2)\). What value of \(x\) is two standard deviations to the right of the mean?
Solution
Step 1 — Turn the wording into a z-score: two standard deviations to the right means \(z = 2\).
Step 2 — Recover \(x\):
$$ x = 4 + (2)(2) = 8 $$Answer: \(x = 8\).
Problem 21. Suppose \(X \sim N(8, 9)\). What value of \(x\) is 0.67 standard deviations to the left of the mean?
Solution
Step 1 — Turn the wording into a z-score: 0.67 standard deviations to the left means \(z = -0.67\).
Step 2 — Recover \(x\) with \(\mu = 8\) and \(\sigma = 9\):
$$ x = 8 + (-0.67)(9) = 8 - 6.03 = 1.97 $$Answer: \(x = 1.97\).
Problem 22. Suppose \(X \sim N(-1, 2)\). What is the z-score of \(x = 2\)?
Solution
Step 1 — Identify the pieces: \(x = 2\), \(\mu = -1\), \(\sigma = 2\).
Step 2 — Substitute into \(z = (x - \mu)/\sigma\):
$$ z = \frac{2 - (-1)}{2} = \frac{3}{2} = 1.5 $$Answer: \(z = 1.5\).
Problem 23. Suppose \(X \sim N(12, 6)\). What is the z-score of \(x = 2\)?
Solution
Step 1 — Identify the pieces: \(x = 2\), \(\mu = 12\), \(\sigma = 6\).
Step 2 — Substitute:
$$ z = \frac{2 - 12}{6} = \frac{-10}{6} \approx -1.67 $$Answer: \(z \approx -1.67\).
Problem 24. Suppose \(X \sim N(9, 3)\). What is the z-score of \(x = 9\)?
Solution
Step 1 — Notice that \(x\) equals the mean: both are 9.
Step 2 — Substitute:
$$ z = \frac{9 - 9}{3} = 0 $$Answer: \(z = 0\). A value sitting exactly at the mean always standardizes to zero.
Problem 25. Suppose a normal distribution has a mean of six and a standard deviation of 1.5. What is the z-score of \(x = 5.5\)?
Solution
Step 1 — Identify the pieces: \(x = 5.5\), \(\mu = 6\), \(\sigma = 1.5\).
Step 2 — Substitute:
$$ z = \frac{5.5 - 6}{1.5} = \frac{-0.5}{1.5} \approx -0.33 $$Answer: \(z \approx -0.33\).
Problem 26. In a normal distribution, \(x = 5\) and \(z = -1.25\). This tells you that \(x = 5\) is ____ standard deviations to the ____ (right or left) of the mean.
Solution
Step 1 — Read the size: the magnitude of the z-score, 1.25, is the number of standard deviations.
Step 2 — Read the sign: it is negative, so the value sits below the mean.
Answer: \(x = 5\) is 1.25 standard deviations to the left of the mean.
Problem 27. In a normal distribution, \(x = 3\) and \(z = 0.67\). This tells you that \(x = 3\) is ____ standard deviations to the ____ (right or left) of the mean.
Solution
Step 1 — Read the size: 0.67 standard deviations.
Step 2 — Read the sign: positive, so above the mean.
Answer: \(x = 3\) is 0.67 standard deviations to the right of the mean.
Problem 28. In a normal distribution, \(x = -2\) and \(z = 6\). This tells you that \(x = -2\) is ____ standard deviations to the ____ (right or left) of the mean.
Solution
Step 1 — Read the size: six standard deviations, which is very far out.
Step 2 — Read the sign: positive, so above the mean — even though \(x\) itself is negative.
Answer: \(x = -2\) is six standard deviations to the right of the mean.
Problem 29. In a normal distribution, \(x = -5\) and \(z = -3.14\). This tells you that \(x = -5\) is ____ standard deviations to the ____ (right or left) of the mean.
Solution
Step 1 — Read the size: 3.14 standard deviations.
Step 2 — Read the sign: negative, so below the mean.
Answer: \(x = -5\) is 3.14 standard deviations to the left of the mean.
Problem 30. In a normal distribution, \(x = 6\) and \(z = -1.7\). This tells you that \(x = 6\) is ____ standard deviations to the ____ (right or left) of the mean.
Solution
Step 1 — Read the size: 1.7 standard deviations.
Step 2 — Read the sign: negative, so below the mean.
Answer: \(x = 6\) is 1.7 standard deviations to the left of the mean.
Problem 31. About what percent of \(x\) values from a normal distribution lie within one standard deviation (left and right) of the mean of that distribution?
Solution
Step 1 — Recall the first line of the Empirical Rule: about 68% of the values lie within one standard deviation of the mean, counting both sides.
Answer: about 68%.
Problem 32. About what percent of the \(x\) values from a normal distribution lie within two standard deviations (left and right) of the mean of that distribution?
Solution
Step 1 — Recall the second line of the Empirical Rule: about 95% of the values lie within two standard deviations of the mean.
Answer: about 95%.
Problem 33. About what percent of \(x\) values lie between the second and third standard deviations (both sides)?
Solution
Step 1 — Take the two bands the question sits between: within three standard deviations holds about 99.7%, and within two holds about 95%.
Step 2 — Subtract to get only the ring between them:
$$ 99.7\% - 95\% = 4.7\% $$Answer: about 4% to 5% of the values — roughly 4.7%, split between the two sides.
Problem 34. Suppose \(X \sim N(15, 3)\). Between what \(x\) values does 68.27% of the data lie? The range of \(x\) values is centered at the mean of the distribution (that is, 15).
Solution
Step 1 — Recognize 68.27% as the one-standard-deviation band.
Step 2 — Go one standard deviation each way from \(\mu = 15\) with \(\sigma = 3\):
$$ 15 - 3 = 12 \qquad \text{and} \qquad 15 + 3 = 18 $$Answer: between \(x = 12\) and \(x = 18\).
Problem 35. Suppose \(X \sim N(-3, 1)\). Between what \(x\) values does 95.45% of the data lie? The range of \(x\) values is centered at the mean of the distribution (that is, \(-3\)).
Solution
Step 1 — Recognize 95.45% as the two-standard-deviation band.
Step 2 — Go two standard deviations each way from \(\mu = -3\) with \(\sigma = 1\):
$$ -3 - 2 = -5 \qquad \text{and} \qquad -3 + 2 = -1 $$Answer: between \(x = -5\) and \(x = -1\).
Problem 36. Suppose \(X \sim N(-3, 1)\). Between what \(x\) values does 34.14% of the data lie?
Solution
Step 1 — Recognize 34.14% as HALF of the 68.27% band: the full one-standard-deviation band holds 68.27%, and the curve is symmetric, so one side of it holds half that.
Step 2 — Take one side only, from the mean out one standard deviation:
$$ -3 \text{ to } -3 + 1 = -2 \qquad \text{(or, on the other side, } -4 \text{ to } -3\text{)} $$Answer: between \(x = -3\) and \(x = -2\) — or, equally correct by symmetry, between \(x = -4\) and \(x = -3\).
Problem 37. About what percent of \(x\) values lie between the mean and three standard deviations?
Solution
Step 1 — Take the three-standard-deviation band: about 99.7% lies within three standard deviations, counting both sides.
Step 2 — Keep only one side:
$$ \frac{99.7\%}{2} \approx 49.85\% $$Answer: about 50%.
Problem 38. About what percent of \(x\) values lie between the mean and one standard deviation?
Solution
Step 1 — Take the one-standard-deviation band: about 68% lies within one standard deviation, both sides.
Step 2 — Keep only one side:
$$ \frac{68\%}{2} = 34\% $$Answer: about 34%.
Problem 39. About what percent of \(x\) values lie between the first and second standard deviations from the mean (both sides)?
Solution
Step 1 — Take the two bands: within two standard deviations holds about 95%, within one holds about 68%.
Step 2 — Subtract to keep only the ring between them:
$$ 95\% - 68\% = 27\% $$Answer: about 27%.
Problem 40. About what percent of \(x\) values lie between the first and third standard deviations (both sides)?
Solution
Step 1 — Take the outer and inner bands: within three standard deviations holds about 99.7%, within one holds about 68%.
Step 2 — Subtract:
$$ 99.7\% - 68\% = 31.7\% $$Answer: about 32%.
Use the following information to answer the next two exercises: The life of wearable fitness devices is normally distributed with a mean of 4.1 years and a standard deviation of 1.3 years. A wearable fitness device is guaranteed for three years. We are interested in the length of time a wearable fitness device lasts.
Problem 41. Define the random variable \(X\) in words. \(X =\) ____.
Solution
Step 1 — Identify what is being measured: 4.1 years and 1.3 years describe how long a device lasts and how much that varies.
Answer: \(X\) = the lifetime, in years, of a randomly chosen wearable fitness device.
Problem 42. \(X \sim\) ____(____, ____)
Solution
Step 1 — Recall the notation: \(X \sim N(\mu, \sigma)\), mean first, standard deviation second.
Step 2 — Fill in the given values: \(\mu = 4.1\) years and \(\sigma = 1.3\) years.
Answer: \(X \sim N(4.1, 1.3)\).
Use the following information to answer the next two exercises: The patient recovery time from a particular surgical procedure is normally distributed with a mean of 5.3 days and a standard deviation of 2.1 days.
Problem 43. What is the median recovery time?
a) 2.7
b) 5.3
c) 7.4
d) 2.1
Solution
Step 1 — Use the symmetry of the normal curve: the median equals the mean.
Step 2 — Read the mean from the setup: 5.3 days.
Answer: b. 5.3
Problem 44. What is the z-score for a patient who takes ten days to recover?
a) 1.5
b) 0.2
c) 2.2
d) 7.3
Solution
Step 1 — Identify the pieces: \(x = 10\) days, \(\mu = 5.3\), \(\sigma = 2.1\).
Step 2 — Substitute:
$$ z = \frac{10 - 5.3}{2.1} = \frac{4.7}{2.1} \approx 2.24 $$Answer: c. 2.2
Problem 45. The length of time to find a parking space at 9 A.M. follows a normal distribution with a mean of five minutes and a standard deviation of two minutes. If the mean is significantly greater than the standard deviation, which of the following statements is true?
I. The data cannot follow the uniform distribution.
II. The data cannot follow the exponential distribution.
III. The data cannot follow the normal distribution.
a) I only
b) II only
c) III only
d) I, II, and III
Solution
Step 1 — Test statement I (uniform): a uniform distribution can easily have a mean much larger than its standard deviation. A uniform distribution on 0 to 10 has mean 5 and standard deviation about 2.89. So I is false.
Step 2 — Test statement II (exponential): for an exponential distribution the mean and the standard deviation are always equal. If the mean is significantly greater than the standard deviation, the data cannot be exponential. So II is true.
Step 3 — Test statement III (normal): a normal distribution's mean and standard deviation are set independently, so a mean of five with a standard deviation of two is a perfectly ordinary normal distribution. So III is false.
Answer: b. II only
Problem 46. The heights of the 430 National Basketball Association players were listed on team rosters at the start of a recent season. The heights of basketball players have an approximate normal distribution with mean \(\mu = 79\) inches and standard deviation \(\sigma = 3.89\) inches. For each of the following heights, calculate the z-score and interpret it using complete sentences.
a) 77 inches
b) 85 inches
c) If an NBA player reported his height had a z-score of 3.5, would you believe him? Explain your answer.
Solution
Step 1 — Set up: \(\mu = 79\) inches, \(\sigma = 3.89\) inches.
Part a — 77 inches:
$$ z = \frac{77 - 79}{3.89} = \frac{-2}{3.89} \approx -0.5141 $$The height of 77 inches is 0.5141 standard deviations below the mean. An NBA player whose height is 77 inches is shorter than average.
Part b — 85 inches:
$$ z = \frac{85 - 79}{3.89} = \frac{6}{3.89} \approx 1.5424 $$The height of 85 inches is 1.5424 standard deviations above the mean. An NBA player whose height is 85 inches is taller than average.
Part c — a reported z-score of 3.5: convert it back to a height with \(x = \mu + z\sigma\).
$$ x = 79 + (3.5)(3.89) = 79 + 13.615 = 92.615 \text{ inches} $$That is taller than 7 feet 8 inches.
Answer: a. \(z \approx -0.51\), shorter than average. b. \(z \approx 1.54\), taller than average. c. The claim works out to 92.615 inches. There are very few NBA players anywhere near that tall, so no, the report is not believable.
Problem 47. The systolic blood pressure (given in millimeters) of males has an approximately normal distribution with mean \(\mu = 125\) and standard deviation \(\sigma = 14\). Systolic blood pressure for males follows a normal distribution.
a) Calculate the z-scores for the male systolic blood pressures 100 and 150 millimeters.
b) If your friend Ryan said he thought his systolic blood pressure was 2.5 standard deviations below the mean, but that he believed his blood pressure was between 100 and 150 millimeters, what would you say to him?
Solution
Step 1 — Set up: \(\mu = 125\), \(\sigma = 14\).
Part a — standardize both pressures:
$$ z = \frac{100 - 125}{14} = \frac{-25}{14} \approx -1.79 $$ $$ z = \frac{150 - 125}{14} = \frac{25}{14} \approx 1.79 $$So 100 mm is about 1.79 standard deviations below the mean and 150 mm is about 1.79 standard deviations above it.
Part b — check whether his two claims can both be true: convert a z-score of \(-2.5\) back to a blood pressure.
$$ x = 125 + (-2.5)(14) = 125 - 35 = 90 $$A reading 2.5 standard deviations below the mean is 90 mm, which is not between 100 and 150.
Answer: a. \(z \approx -1.79\) and \(z \approx 1.79\). b. The two claims contradict each other. A z-score of \(-2.5\) corresponds to a reading of 90 mm, and anything between 100 and 150 mm has a z-score between about \(-1.79\) and \(1.79\). One of the two pieces of information has to be wrong, so he should recheck the actual reading.
Problem 48. Mateo's doctor told him that the z-score for his systolic blood pressure is 1.75. Which of the following is the best interpretation of this standardized score? The systolic blood pressure (given in millimeters) of males has an approximately normal distribution with mean \(\mu = 125\) and standard deviation \(\sigma = 14\). If \(X\) = a systolic blood pressure score then \(X \sim N(125, 14)\).
a) Which answer(s) is/are correct?
i. Mateo's systolic blood pressure is 175.
ii. Mateo's systolic blood pressure is 1.75 times the average blood pressure of men his age.
iii. Mateo's systolic blood pressure is 1.75 above the average systolic blood pressure of men his age.
iv. Mateo's systolic blood pressure is 1.75 standard deviations above the average systolic blood pressure for men.
b) Calculate Mateo's blood pressure.
Solution
Part a — check each interpretation:
i. Wrong. 1.75 is a z-score, not a blood pressure reading.
ii. Wrong. A z-score is not a multiplier of the average.
iii. Wrong. This drops the units — 1.75 standard deviations above the mean is not 1.75 mm above it.
iv. Correct. A z-score of 1.75 means the value is 1.75 standard deviations above the mean.
Part b — recover the reading with \(x = \mu + z\sigma\):
$$ x = 125 + (1.75)(14) = 125 + 24.5 = 149.5 $$Answer: a. iv. b. Mateo's systolic blood pressure is 149.5 millimeters.
Problem 49. Height and weight are two measurements used to track a child's development. The World Health Organization measures child development by comparing the weights of children who are the same height and the same gender. In 2009, weights for all 80 cm girls in the reference population had a mean \(\mu = 10.2\) kg and standard deviation \(\sigma = 0.8\) kg. Weights are normally distributed, so \(X \sim N(10.2, 0.8)\). Calculate the z-scores that correspond to the following weights and interpret them.
a) 11 kg
b) 7.9 kg
c) 12.2 kg
Solution
Step 1 — Set up: \(\mu = 10.2\) kg, \(\sigma = 0.8\) kg.
Part a — 11 kg:
$$ z = \frac{11 - 10.2}{0.8} = \frac{0.8}{0.8} = 1 $$An 80 cm girl weighing 11 kg is one standard deviation above the reference mean — a little heavier than typical for her height.
Part b — 7.9 kg:
$$ z = \frac{7.9 - 10.2}{0.8} = \frac{-2.3}{0.8} = -2.875 $$She is 2.875 standard deviations below the mean, which is unusually light for her height.
Part c — 12.2 kg:
$$ z = \frac{12.2 - 10.2}{0.8} = \frac{2}{0.8} = 2.5 $$She is 2.5 standard deviations above the mean, which is unusually heavy for her height.
Answer: a. \(z = 1\). b. \(z = -2.875\). c. \(z = 2.5\). Both b and c fall outside two standard deviations, so those two children are in the roughly 5% of the reference population that is furthest from the middle.
Problem 50. During a certain year, 1,475,623 students heading to college took the SAT. The distribution of scores in the math section of the SAT follows a normal distribution with mean \(\mu = 520\) and standard deviation \(\sigma = 115\).
a) Calculate the z-score for an SAT score of 720. Interpret it using a complete sentence.
b) What math SAT score is 1.5 standard deviations above the mean? What can you say about this SAT score?
c) During a different year, the SAT math test had a mean of 514 and standard deviation 117. The ACT math test is an alternate to the SAT and is approximately normally distributed with mean 21 and standard deviation 5.3. If one person took the SAT math test and scored 700 and a second person took the ACT math test and scored 30, who did better with respect to the test they took?
Solution
Let \(X\) = an SAT math score and \(Y\) = an ACT math score. Use \(z = (x - \mu)/\sigma\) throughout.
Part a — standardize a score of 720, with \(\mu = 520\) and \(\sigma = 115\):
$$ z = \frac{720 - 520}{115} = \frac{200}{115} \approx 1.74 $$The exam score of 720 is 1.74 standard deviations above the mean of 520.
Part b — go the other way with \(x = \mu + z\sigma\) for \(z = 1.5\):
$$ x = 520 + (1.5)(115) = 520 + 172.5 = 692.5 $$The math SAT score is 692.5, which is 1.5 standard deviations above the mean of 520.
Part c — put the two tests on the same scale. The SAT taker scored 700 on a test with \(\mu = 514\), \(\sigma = 117\):
$$ z = \frac{700 - 514}{117} \approx 1.59 $$The ACT taker scored 30 on a test with \(\mu = 21\), \(\sigma = 5.3\):
$$ z = \frac{30 - 21}{5.3} \approx 1.70 $$Answer: a. \(z \approx 1.74\). b. 692.5. c. The ACT taker did better with respect to the test they took, because their z-score of about 1.70 is higher than the SAT taker's 1.59.
Key Terms
standard normal distribution — the normal distribution with mean zero and standard deviation one, written \(Z \sim N(0, 1)\).
z-score — the number of standard deviations a value lies above or below the mean of its own distribution, \(z = (x - \mu)/\sigma\).
standardized value — a value re-expressed as a z-score, so that distributions on different scales can be compared directly.
Empirical Rule — for a normal distribution, about 68%, 95%, and 99.7% of the data lie within one, two, and three standard deviations of the mean; also called the 68-95-99.7 rule.